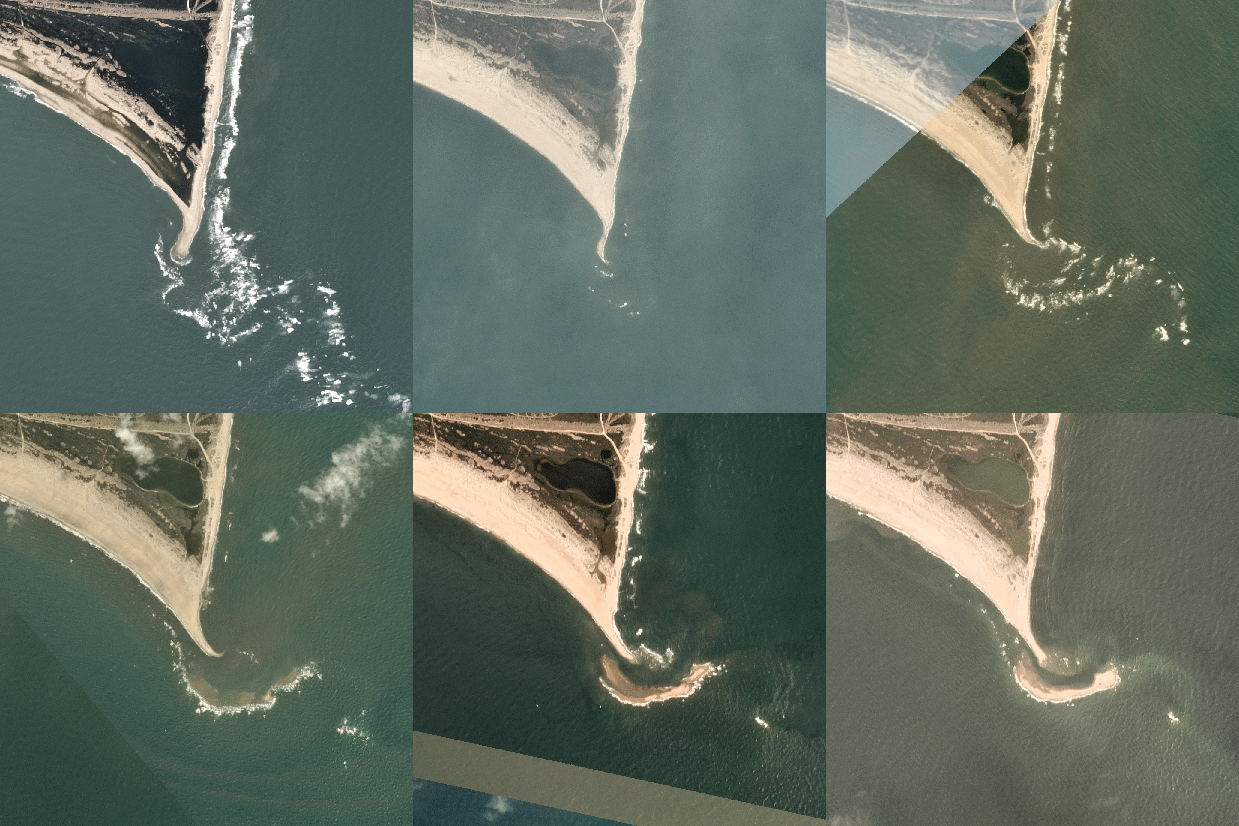
Shoreline Change Detection
Shorelines keep changing and evolving and there seems to be global processes that control this building and destruction of coastlines. A lot of impetus has been provided to use the shoreline datasets to measure or estimate retreat and whether these are cyclic changes and/or are these changes persistent and permanent. Earlier studies looking into Shoreline Changes have shown importance of monitoring. As climate change processes change the overall dynamics of short term and long term climate phenomenon, with the increase in relative sea level rise, this concern becomes even more and more critical.
Data Source
The Open Calfornia datasets contains areas of most common changes for example one along La Jolla Shores. You can add this and start by looking at changes in land and water area over time. This dataset part of our Open California Dataset and is available for download. We have also uploaded this imagery to Google Earth Engine for you to be able to pull this automatially.
//Date Range 2017-01-01 to 2017-12-31
var lajolla_aoi=ee.FeatureCollection('ft:1jPOwve6hzSGJylfvIZPlRH55h8sbDxbs5idcmx5o') //AOI boundary for subset of La Jolla shores
var lajolla_img=ee.ImageCollection('projects/sat-io/Planet/harvey_ps') //Image Collection for subset of La Jolla shores with PlanetScope 4Band analytic imagery
Turns out there have been some activity already in terms of using time series shoreline dataset to look at islands. You can read about it in this Planet Story about shoreline changes in North Carolina.

Suggested Methods
You can approach this problem in multiple ways including looking at simple image differencing to estimate changes some of which might be seasonal versus episodic changes in the landscape. These images might also be used to look at intertida zones, by combining this imagery along with Landsat and Sentiel-2 optical imagery. You can detect change in overall shoreline area that contribues towards a simple analysis pipeline that could be applied to detect coastline/shoreline loss.