Analytics: Query and Plot
Assuming you had already filled in the Google Form and accepted the Google repository, you should now have access to this toolbox. Remember you have access to both the datasets and the toolbox through the Google Group. We are going to use the toolbox to query, analyze Planet datasets. These are in no way a complete list of complex functionalities of Planet Imagery with Google Earth Engine but they are useful starting points. This code allows you to query our ingested dataset and plot a monthly count histogram. You can create some other useful animations like heatmaps to represent image count over specific areas. Tool 1 in your toolbox lets you print the collection size, a single image to check its metadata and create monthly frequencies. You can also copy and edit the code form below
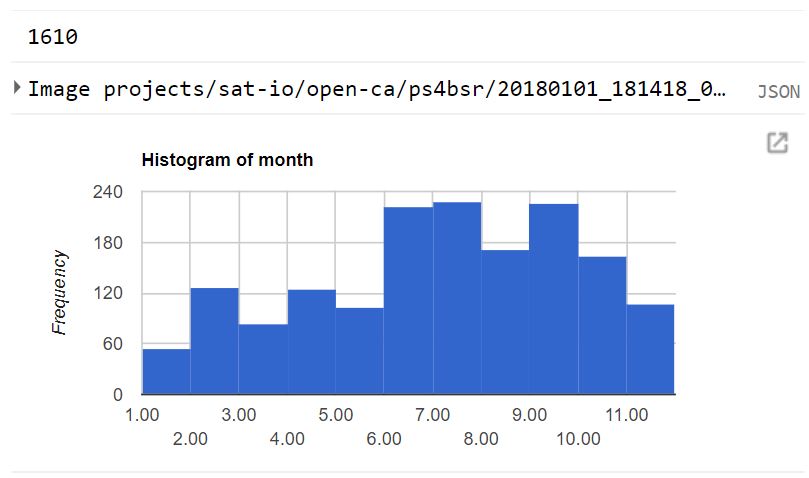
//Add AOI and add Image Collection
var collection=ee.ImageCollection('projects/sat-io/open-ca/ps4bsr')
var aoi=ee.FeatureCollection("projects/sat-io/open-ca/aoi")

//Center at the AOI
Map.centerObject(aoi,14)

//Get Collection Size
print(collection.size())

//Inspect a single image and metadata
print(collection.first())

//Add visualization
var vis = {"opacity":1,"bands":["b4","b3","b2"],"min":608.6288888888889,"max":2665.4822222222224,"gamma":1.856};

//Clip and Add an Image
Map.addLayer(collection.median().clip(aoi),vis,'Median PS4B SR',false)

//Create Monthly Frequency Histogram
var collection = ee.ImageCollection('projects/sat-io/open-ca/ps4bsr')
    .map(function(img) {
      var date = ee.Date(img.get('system:time_start'))
      return img.set('month', date.get("month"));
    })

print(Chart.feature.histogram(collection, "month"))