Multiyear Cloud Free Composites in Earth Engine
One of the most sought after functions in Earth Engine is the possibility of using deep time stack imagery to create cloud free composites. One of the simplest way of thinking about this is to use reducers that we talked about earlier, where we look at an entire stack of pixels and choose the median value of the distribution of pixel across stack and we end up getting a cloud free composite over the given time period. Depending on the number of images, the actual number of cloud free images in the overall stack your results may need more fine tune adjustments.
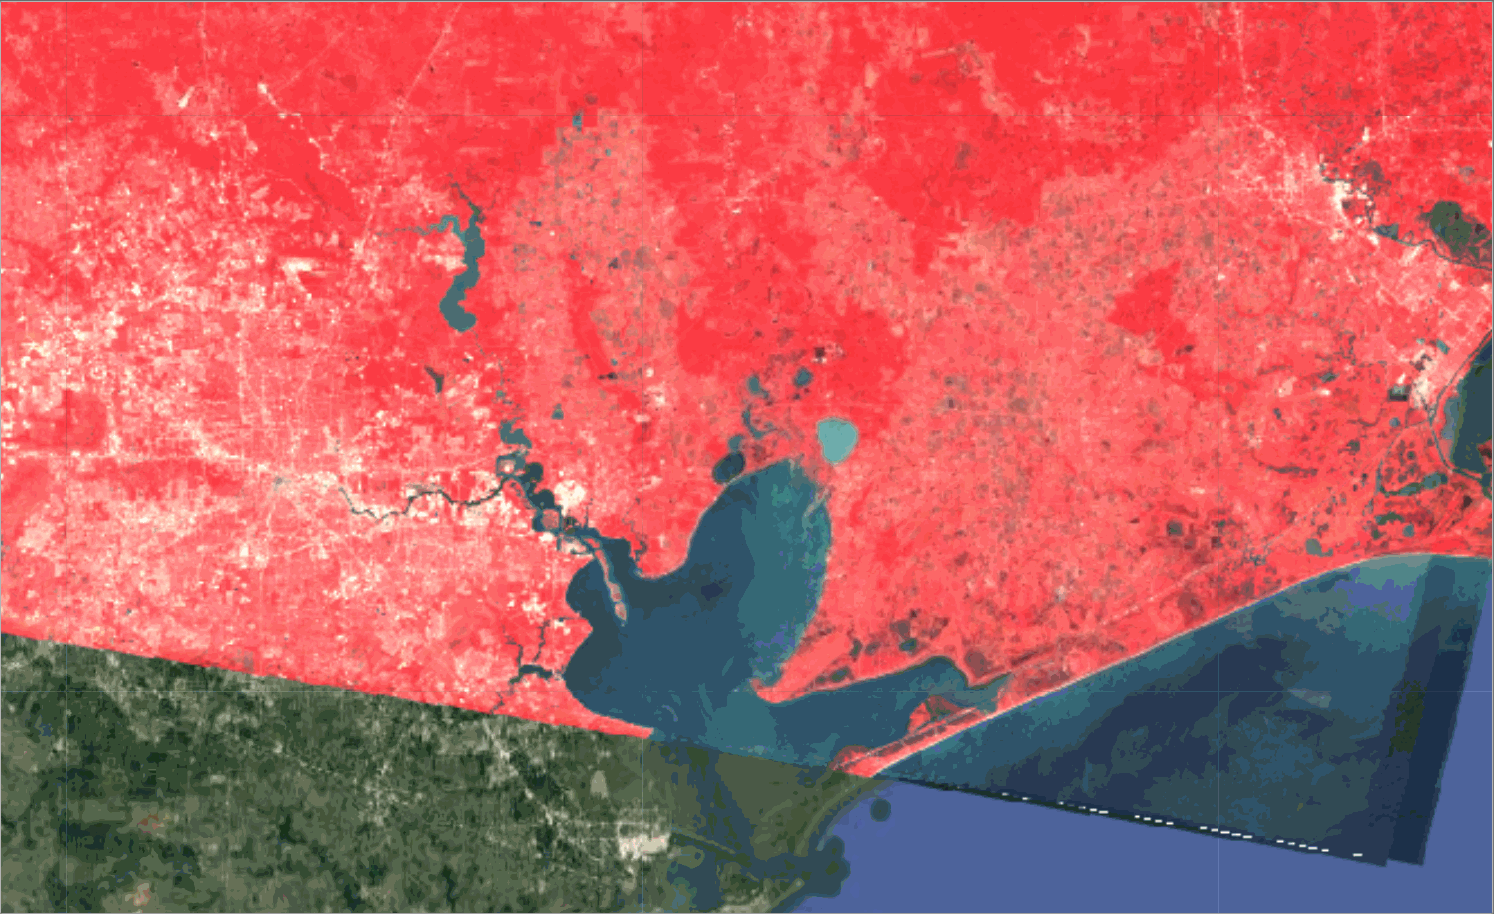
For this setup we look at how we added Landsat 5 Surface Reflectance data earlier , filtering it using WRS Path and Row and further using Cloud cover for the scene. The next step we are building an function to calculate yearly composites from 1984 to 2010 using the Landsat 5 data. Note that this is another way of creating a function where we have inserted the map function and the collection inside the function so it can be run directly. We might be interested in sorting these collections using year and hence we set the year as a metadata for each image in the cloud free composite. Depending on the type of imagery another good way of creating cloud free composites is by using the pixel qa bit bands in the Landsat surface reflectance imagery.
//Add an image collection
var collection=ee.ImageCollection('LANDSAT/LT05/C01/T1_SR')

//Filtering an Image Collection
var filtered=collection.filterMetadata('WRS_PATH','equals',25)
.filterMetadata('WRS_ROW','equals',39).filterMetadata('CLOUD_COVER','less_than',15)

//print filtered collection properties
print("Filtered Collection",filtered)

//Create Multi Year Composite from Landsat 5 Surface Reflectance
var years = ee.List.sequence(1984, 2010)

var multiyear = ee.ImageCollection(years
  .map(function(y) {
    var start = ee.Date.fromYMD(y, 1, 1)
    var end = start.advance(1, 'year');
    var image = filtered.filterDate(start, end).median();
    return image.set('year', y)
}))

print(multiyear);

//Add a visualization
var vis = {"opacity":1,"bands":["B4","B3","B2"],"min":-95.56918120427508,"max":2171.008347369839,"gamma":1};

//Add the Image
Map.addLayer(ee.Image(ee.ImageCollection(multiyear).first()),vis,"Median from MultiYear")