Functions in Earth Engine: NDVI
While single image operations are direct and can be applied to the imagery for a one to one result. Applying any kind of analysis on a single image means you have to call the image and run the analysis which is quick and easy. To be able to turn this same into a function that you can iterate over an entire collection requires us to convert a single analysis to a function. A function is then mapped or run over an entire collection. To avoid any errors make sure that the collection images are consistent and have same name and number of band and characteristics.
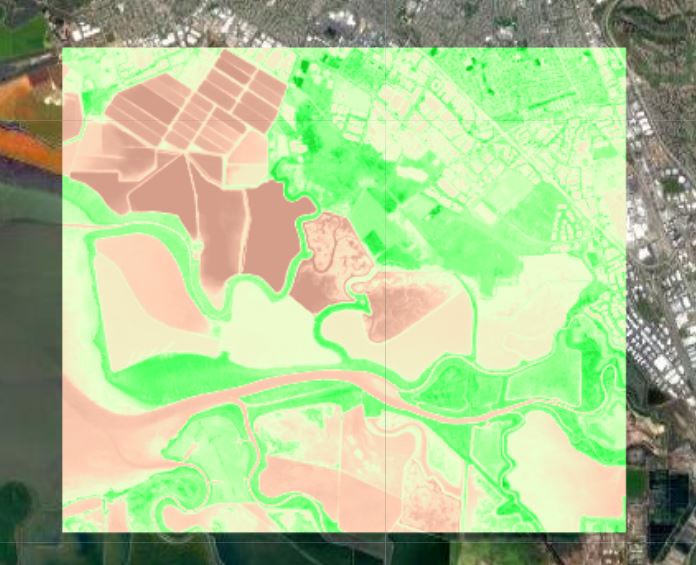
For this setup we look at how we added PlanetScope Surface Reflectance data earlier , filtering it using date and further using Cloud cover for the scene. The next step we are building an function to calculate Normalized Difference Vegetation Index (NDVI) over the entire collection which takes an image collection and iteratively passes an image to the function. The resultant structure is also an image collection where we are returning a single band which is the NDVI. Note that we also renamed the band to NDVI since they are not autorenamed
You can access the script here or copy and paste from below
//Add an AOI
var aoi=ee.FeatureCollection("users/io-work-1/vector/subset")

//Zoom to the AOI
Map.centerObject(aoi,13)

//Add an image collection
var collection=ee.ImageCollection('users/io-work-1/open-ca/PS4BSR')

//Filtering an Image Collection
var filtered=collection.filterDate('2018-06-01','2018-08-31')//Filter for March
.filterMetadata('cloud_cover','less_than',0.2)//Cloud cover less than 20%
.filterBounds(aoi)//Filter by only the subset area of interest

//print filtered collection properties
print("Filtered Collection",filtered)


/*==================================================*/
//Writing a function
var addNDVI = function(image) {
  var ndvi = image.normalizedDifference(['b4', 'b3']).rename('NDVI');
  return ndvi;
};

var ndvicoll=filtered.map(addNDVI)
print("NDVI Collection",ndvicoll)

//Let's add a palette for us to show the results
var ndvivis = {"opacity":1,"bands":["NDVI"],"min":-0.259,"max":0.57,"palette":["d49e8a","ffcfb4","ecffcf","94ff8d","3eff56","15cc23"]};

//Add the median of the result
Map.addLayer(ee.Image(ndvicoll.median()).clip(aoi),ndvivis,"NDVI")