Change in Biomass: Indicators of Natural Disaster
We are surrounded by natural events and changes in our land use and land cover owing to seasonal variations along with sudden episodic and periodic events. These events for examples natural disasters like cyclones, hurricances and flood events to name a few. Often time the chances of direct observation of these events as they happen are difficult at current temporal frequency, though we keep moving to realizing that. Our next best approach is often looking at the difference before and after an event occurs and more often than not natural vegetation patterns along with the land cover is disturbed or changed after an event. There may also be other proxies such as wetter areas with more area of water, or more sediment that has been deposited over the land and is now visible.
Data Source
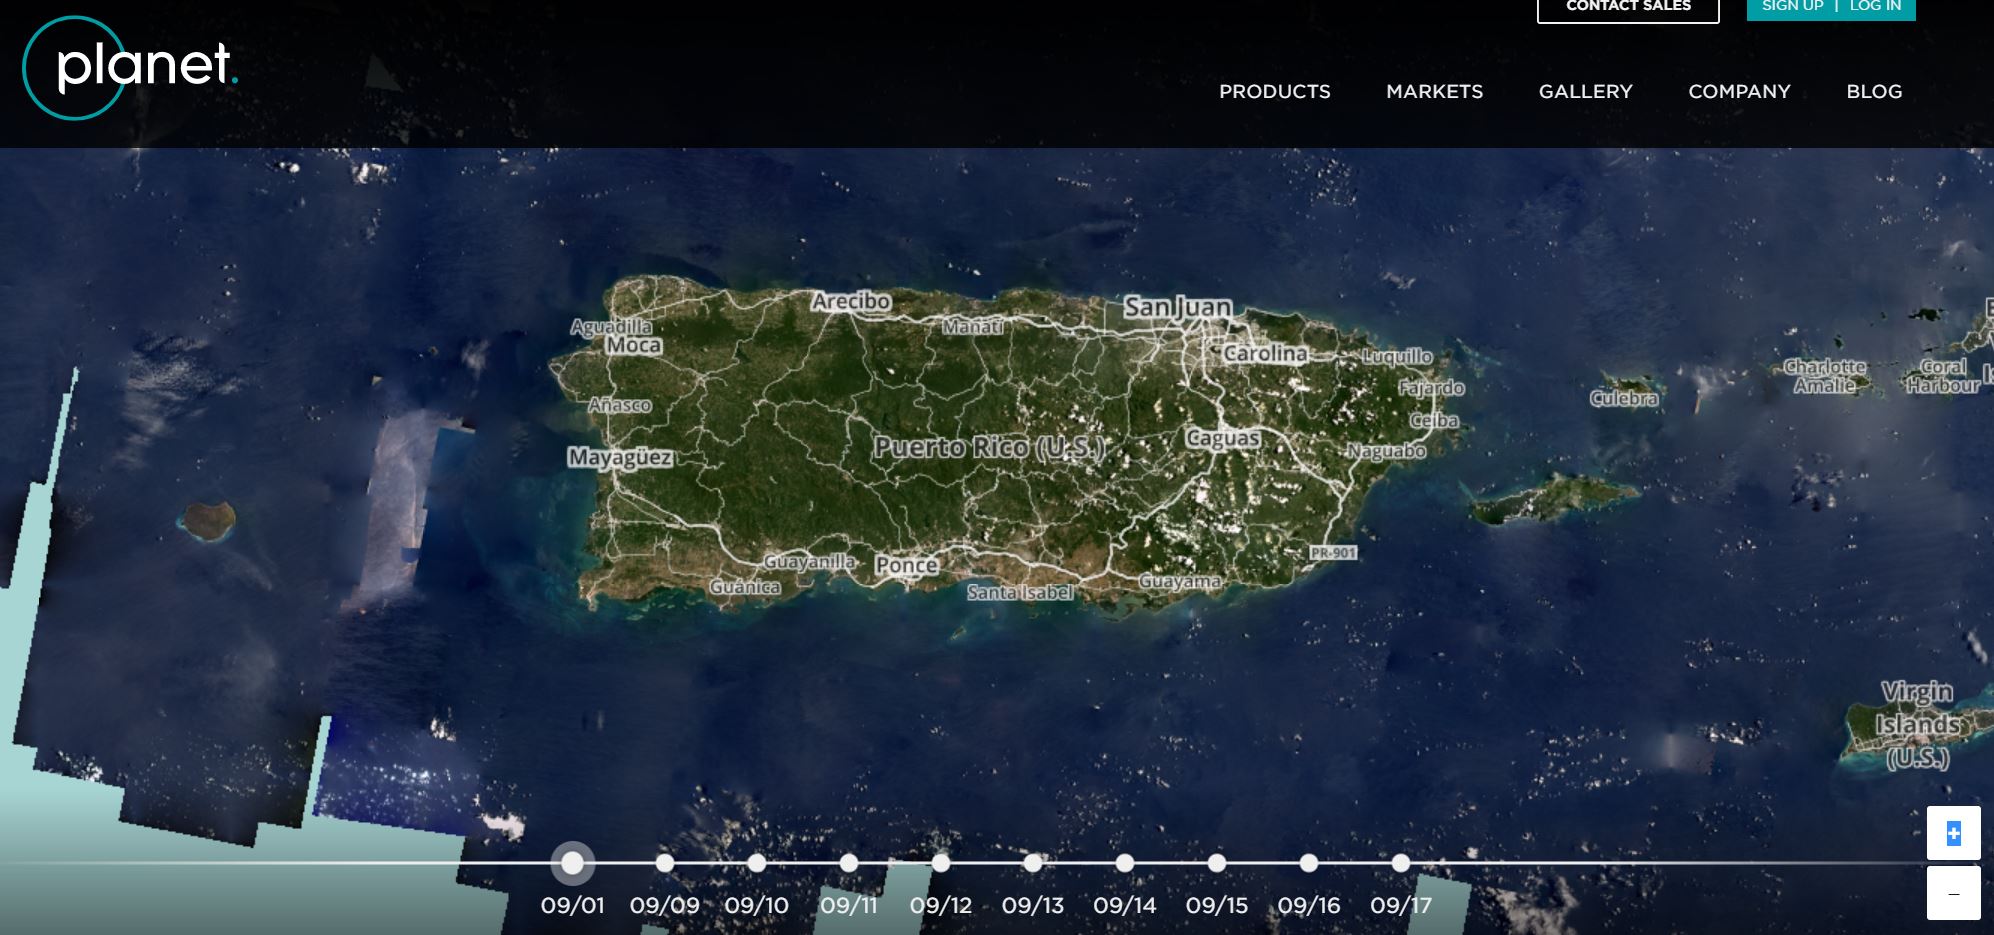
We are providing you with before and after imagery from Puerto Rico before and after the hurricance. These images have been loaded upto onto Google Earth Engine already but if you would like to use them locally they can be downloaded. This is part of our Planet's disaster data initiative where we make images available to you for a short windows of time.
You can get the images and the aoi here
//Date Range 2017-08-01 to 2017-09-30 (Date of Event 2017-08-28)
var maria_aoi=ee.FeatureCollection('ft:1fnjhy6J3VHOdqbWlXwRjHvEtdrfT2wkwG1Qt5W62') //AOI boundary for San Juan affected by Maria
var maria_img=ee.ImageCollection('projects/sat-io/Planet/pr_maria_ps') //Image Collection San Juan affected by Maria with PlanetScope 4Band analytic imagery
Suggested Methods
One of the most commonly used indices to develop a direct correlationship with vegetation dynamics is Normalized Difference Vegetation Index or NDVI. There are additional indicator indices which look for effect of differences in NDVI such as using the Misra Soil Index. Performing a trend analysis should provides proxies to a sudden event such as Hurricane Irma
Performing a simple NDVI analysis
Doing band math in Google Earth Engine is fairly simple and you can call upon simple functions such as sum, divide, subtract
//Add the image(note this is specific to your path)
var image = ee.Image('projects/sat-io/Planet/pr_maria_ps/20170803_141049_101f_analytic')

//Perform the NDVI operation
var ndvi = image.normalizedDifference(['b4', 'b3']).rename('NDVI');

//Center the Map to your image
Map.centerObject(image,12)

//Cheat just a bit and add a visualization format
var vis = {"opacity":1,"bands":["b4","b3","b2"],"min":304,"max":4275,"gamma":1};
var ndviParams = {min: -1, max: 1, palette: ['green', 'white', 'blue']};

//Now let's add this image and visualize before and after clipping
Map.addLayer(image,vis,"Image")
Map.addLayer(ndvi,ndviParams,"Image NDVI")
We press run and find a beautiful index for the image

To run NDVI over the entire collection we create a function and then iterate the function(also called mapping the function) over the entire collection
Here is the NDVI function to be applied to the collection
var addNDVI = function(image) {
  var ndvi = image.normalizedDifference(['b4', 'b3']).rename('NDVI');
  return ndvi;
};
Running the function on the overall collection reduces the imagery from a 4 band PlanetScope imagery to a single band NDVI product.

The overall code now becomes
var imageCollection=ee.ImageCollection('users/planet/planet-sr')
var addNDVI = function(image) {
  var ndvi = image.normalizedDifference(['b4', 'b3']).rename('NDVI');
  return ndvi;
};
var collectionNDVI=imageCollection.map(addNDVI)

//Print the results to understand what is going on
print(imageCollection,"Actual 4 Band collection")
print(collectionNDVI,"Collection with NDVI performed")