Urban Growth and Movement
The Connectivity Lab at Facebook released high resolution population datasets for a couple of countries these are done using high resolution training data at 0.5 m resolution and can be used to understand urban density and movement. This is a 3band product where based on information from Center for International Earth Science Information Network(CIESIN) “pop,” or Band 1, represents the number of persons estimated to live in each pixel; “settlement” or Band 2, is a mask representing pixels within which one or more buildings was detected with a value of 1; and “clouds,” or Band 3, is a mask representing pixels that contained clouds in the source imagery with a value of 1. Apart from this dataset to look at urban dynamics we can use night lights to estimate growth in urban areas and populations such as those from VIIRS dataset. Apart from this there is Gridded Population of the World also made available from CIESIN.
Data Source
We have ingested 13 High Resolution Settlement Layers(HRSL) layers into Google Earth Engine for you to use during the period of the hackathon. Apart from these you can also look into a special collection bucket that contains specific imagery. You can perform a land use and land cover change analysis to see if urban settlements have increased but apart from that you can also look at Visible Infrared Imaging Radiometer Suite (VIIRS) daily data to look at areas with decreasing or increasing intensity of population chang and dynamics that we measure from these proxies. For this study we are making data for Mexico city available to you for six months period 2017-01-01 to 2017-06-30. This can be compbined with Night Light data and with Open Street Map data to run understand if there are discernable changes within that time period.
//Date Range 2016-01-01 to 2017-06-30 at 0-99% cloud cover
var mexicocity_aoi=ee.FeatureCollection('ft:1RhOhAGrbUn0vRlrRRFulpfj0MNN6DrGd2PNBC38-') //AOI boundary for Area within Mexico City
var mexicocity_img=ee.ImageCollection('projects/sat-io/Planet/mexicocity_ps') //Image Collection for Mexico City with PlanetScope 4Band analytic imagery
Suggested Methods
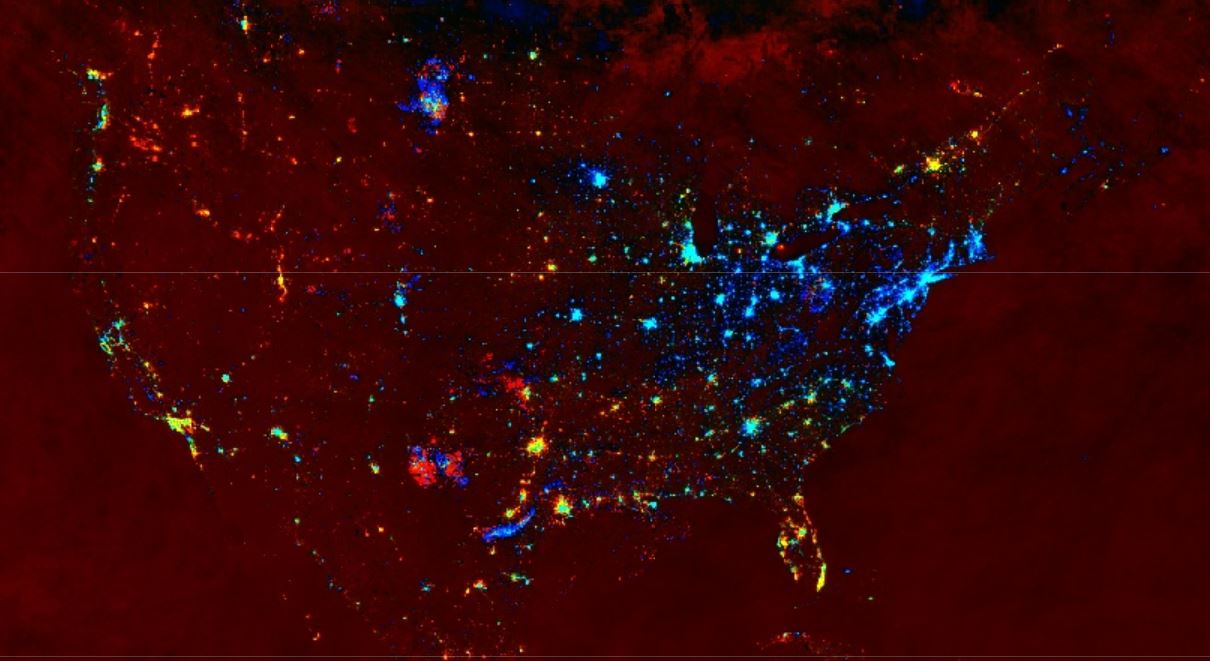
Use a linear trend analysis to determine if certain areas are gaining large clusters of populations and some areas that are slowly losing populations owing to war, genocide, climate migration among other things. One of the simplest application of using the Night time lights dataset to create this can be found at the GEE Github page and I replicating this here
using the DMSP-OLS Nighttime Lights Time Series Version 4
// Compute the trend of night-time lights.

// Adds a band containing image date as years since 1991.
function createTimeBand(img) {
  var year = ee.Date(img.get('system:time_start')).get('year').subtract(1991);
  return ee.Image(year).byte().addBands(img);
}

// Map the time band creation helper over the night-time lights collection.
// https://earthengine.google.org/#detail/NOAA%2FDMSP-OLS%2FNIGHTTIME_LIGHTS
var collection = ee.ImageCollection('NOAA/DMSP-OLS/NIGHTTIME_LIGHTS')
    .select('stable_lights')
    .map(createTimeBand);

// Visualize brightness in green and a linear fit trend line in red/blue.
Map.addLayer(
    collection.reduce(ee.Reducer.linearFit()),
    {min: 0, max: [0.18, 20, -0.18], bands: ['scale', 'offset', 'scale']},
    'stable lights trend');
I have modified only two lines of code to create the same from VIIRS dataset
// Compute the trend of night-time lights.

// Adds a band containing image date as years since 2014.
function createTimeBand(img) {
  var year = ee.Date(img.get('system:time_start')).get('year').subtract(2014);
  return ee.Image(year).byte().addBands(img);
}

// Map the time band creation helper over the night-time lights collection.
/var collection = ee.ImageCollection('NOAA/VIIRS/DNB/MONTHLY_V1/VCMSLCFG')
    .select('avg_rad')
    .map(createTimeBand);

// Visualize brightness in green and a linear fit trend line in red/blue.
Map.addLayer(
    collection.reduce(ee.Reducer.linearFit()),
    {min: 0, max: [0.18, 20, -0.18], bands: ['scale', 'offset', 'scale']},
    'stable lights trend');
Use planet data for verification of change in urban area and settlement area in general post assessment of hot spots for analysis.