Fire detection and Analysis
As climate change effects the frequency , intentisty and location of forest disturbances, forest fires and fires in general. These disturbances and forest fires have been studies and records maintained for a long period of time. Infact Fire and Smoke is one of the missions that NASA has and maintains. To be able to study this a Fire Information for Resource Management System (FIRMS) was creatd which provides a near real time active fire data using Moderate Resolution Imaging Spectroradiometer (MODIS) and the Visible Infrared Imaging Radiometer Suite (VIIRS). This allows the user to ovserve fire events within 3 hours of overpass of the satellite. You can then use higher rsolution imagery to refine and study the same area with higher, spatial, temporal and spectral resolutions. There are more local fires services for fire measurement such as the California Statewide Fire Map
Data Source
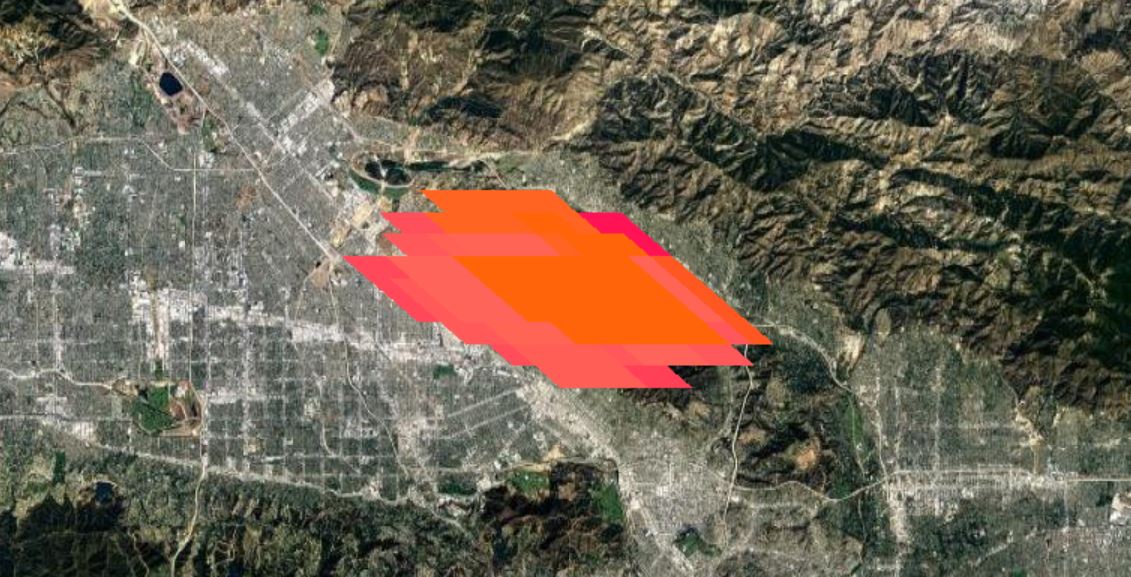
The Open Calfornia datasets contains areas of most common fires within the last year, La Tuna fire The fire—one of the largest in Los Angeles history—consumed over 7,000 acres of brush from September 1-7, endangering nearby homes, freeways and schools. This is part of our Open California Dataset and is available for download. We have also uploaded this imagery to Google Earth Engine for you to be able to pull this automatially.
Turns out GEE already processes and ingest FIRMS data for now updated from November 2000- Present and here is their description. You can add the collection by simply adding this line
//Date of Incident 2017-09-02
var latuna_aoi=ee.FeatureCollection('ft:1_xiEkvDLlvkrDCnIQ0dfPh60dasj8VTHZs17UT06') //AOI boundary for Latuna Fire
var latuna_img=ee.ImageCollection('projects/sat-io/Planet/latuna_ps') //Image Collection for La Tuna fire with PlanetScope 4Band analytic imagery
var firms= ee.ImageCollection('FIRMS') // Fire Information for Resource Management System
Incase you are interested in working with fire at a different location, we have ingested and released some dataset from fire in Argentina. This was released as part of our Disaster Monitoring Program and you can find more details here.
//Date of Incident 2017-01-06
var argentina_aoi=ee.FeatureCollection('ft:1y-R9oXLukDlhgyMTLATqmdUZc5uSfJy56W0co7EX') //AOI boundary for Argentina Fire
var argentina_img=ee.ImageCollection('projects/sat-io/Planet/argentina_ps') //Image Collection for Argentina fire with PlanetScope 4Band analytic imagery
var firms= ee.ImageCollection('FIRMS') // Fire Information for Resource Management System
The Earth Engine version of the Fire Information for Resource Management System (FIRMS) dataset contains the LANCE fire detection product in rasterized form. The near real-time (NRT) active fire locations are processed by LANCE using the standard MODIS MOD14/MYD14 Fire and Thermal Anomalies product. Each active fire location represents the centroid of a 1km pixel that is flagged by the algorithm as containing one or more fires within the pixel. The data are rasterized as follows: for each FIRMS active fire point, a 1km bouding box (BB) is defined; pixels in the MODIS sinusoidal projection that intersect the FIRMS BB are identified; if multiple FIRMS BBs intersect the same pixel, the one with higher confidence is retained; in case of a tie, the brighter one is retained.

Suggested Methods
Find some of the active firest in our area of interest and look at the effect, for example adding the La Tuna fires over our area of interest can be achieved with the following lines of code. To go to this specific fire events within the FIRMS database try this
//Add the collection and filter by Date
var firms= ee.ImageCollection('FIRMS').filterDate('2017-09-02','2017-09-03')

//There is only one image in the collection now so let's add the first/only one
Map.addLayer(ee.Image(ee.ImageCollection(firms.first())))

//Set a lat long and zoom level for the setup
Map.setCenter(-118.3179, 34.218,11)

//To make it look slightly better set the background to be Satellite imagery instead of Map
Map.setOptions('SATELLITE')
Think about developing this further, what would change and how woudl you detect the change after an areas has been burnt. Can we use NDVI from my biomass study to study effects on vegetation or are there image differencing methods that give you better information.