Flood Impact
As climate change and extreme climate events increase in frequency the notion of safe zones and areas which are rarely affected by natural disaster needs to be redefined. Our current definitions of areas under risk of flood indundation for example is often tied to porximity to flood plains though urban flood freuqency over the past decade points towards loss and impact at non proximal areas as well. The question here would be how do you use Planet's pre and post event dataset to understand standard land cover versus indundation affected areas.
Data Source
We are providing you with before and after imagery from areas near Houston which was affected by Harvey before and after the hurricance. These images have been loaded upto onto Google Earth Engine(GEE) already but if you would like to use them locally they can be downloaded. This is part of our Planet's disaster data initiative where we make images available to you for a short windows of time.
You can get the images and the aoi here
//Date Range 2017-08-01 to 2017-09-30 (Date of Event 2017-08-28)
var harvey_aoi=ee.FeatureCollection('ft:1WbrmxoQPDsJS35XKwBW7T6kjyjiS7h7d976vNWV7') //AOI boundary for Houston Flooding
var harvey_img=ee.ImageCollection('projects/sat-io/Planet/harvey_ps') //Image Collection for Area with Houston Flooding with PlanetScope 4Band analytic imagery
Apart from this the Advanced Rapid Imaging and Analysis (ARIA) team at NASA's Jet Propulsion Laboratory also created flood proxy map to show areas that are indundated using ALOS and Sentinel-1 data which are capable of looking at areas effected using Synthetic Aperture Radar datasets. We have uploaded this to earthengine so that they can be used to mask out areas which were flooded during the event. Population data is also included in GEE using TIGER: US Census Tracts Demographic - Profile 1 Dataset. You can read more about the designation here. You can add these to your code using
var census=ee.FeatureCollection('TIGER/2010/Tracts_DP1')
Suggested Methods
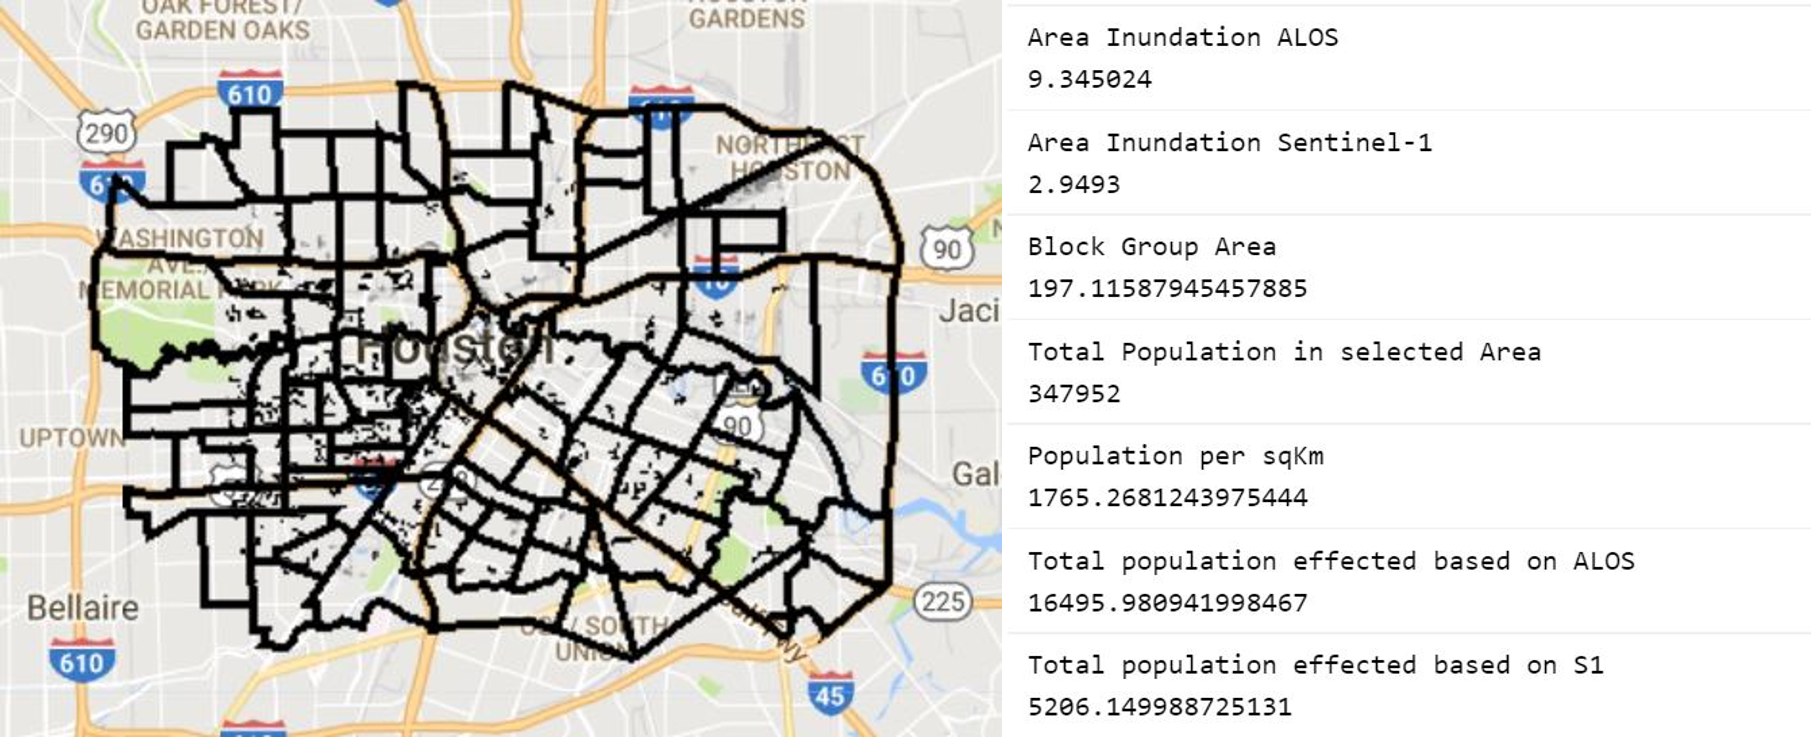
NASA(s) developed flood masks would be the first step to start but if you find a finer resolution dataset to show flooded areas and extent feel free to use that. You would be able to calculate flooded area in each block group and you can also integrate census data to estimate number of people affected by this using census data that are available at Block group level within the US. This gives you an estimate of number of people effected and potentially displaced from these areas. A simple analysis for example for an extremely small area results in following metrics which might be a starting point